SAFETY CULTURE SURVEY PLATFORM
Quantify your safety culture with precision.
The industry-standard EWN safety survey platform. Move beyond basic compliance to deep cultural insights that reduce risk and save lives.
THE PROBLEM
Culture data that never becomes a decision
Most safety culture programs stall before the data reaches a decision-maker.
Surveys live in silos
One-off forms per site, no shared instrument, no way to compare last year to this year.
Results stop at averages
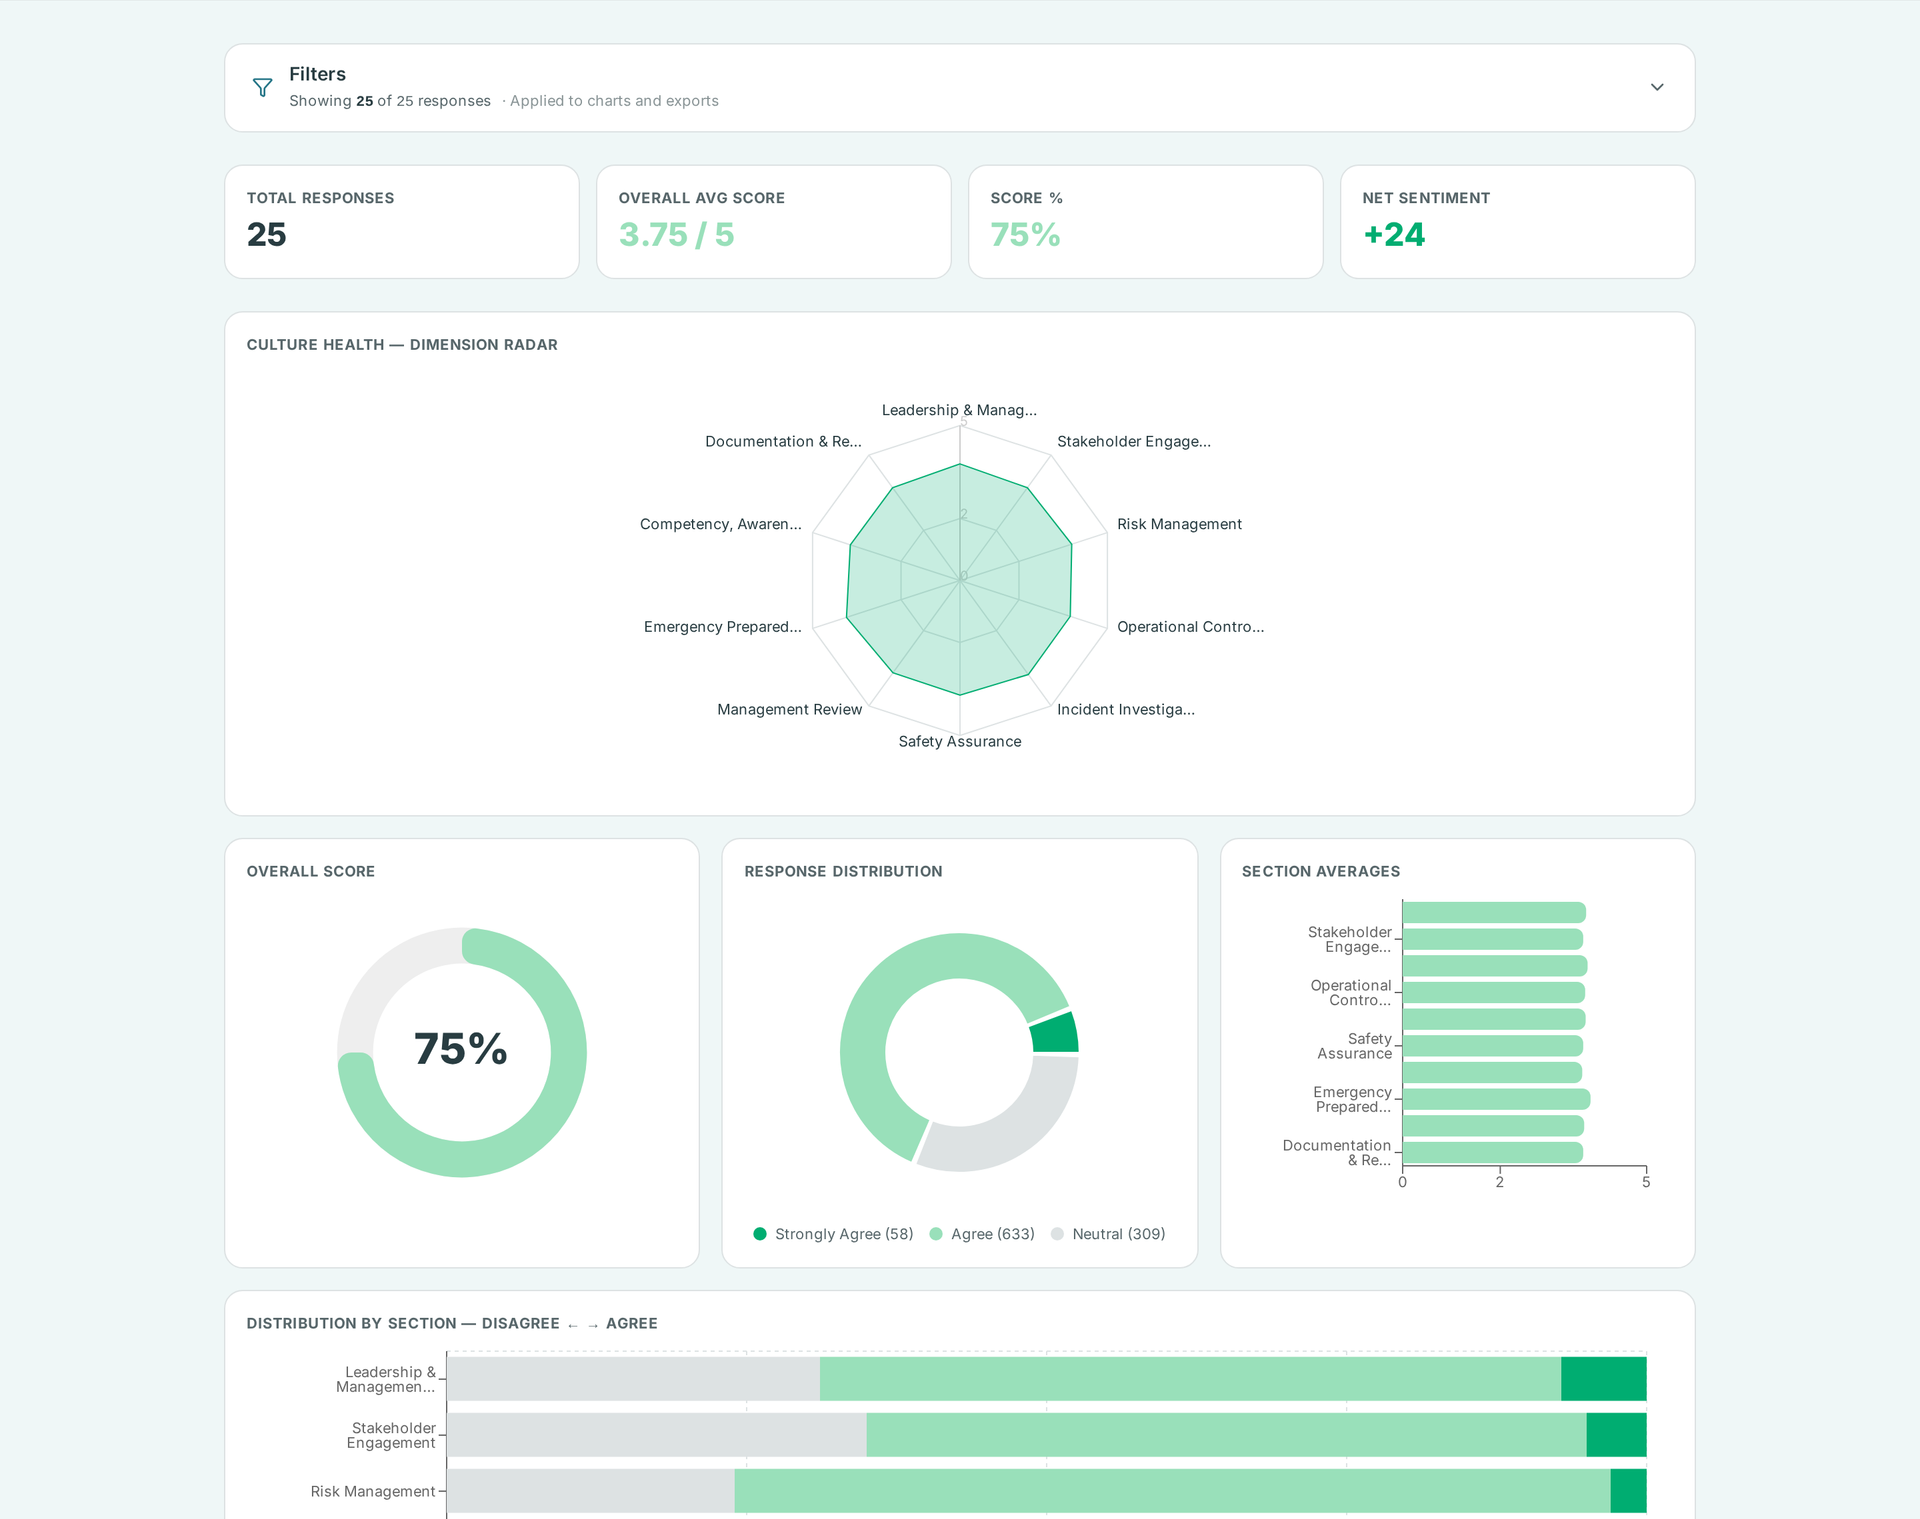
A single score per section hides the pockets of risk, the polarized crews, and the shift that quietly stopped reporting.
Nothing lands with leadership
One-off forms per site, no shared instrument, no way to compare last year to this year.
WHAT'S INSIDE
Everything a culture program needs, in one place
Most safety culture programs stall before the data reaches a decision-maker.
Survey builder
Sections, Likert scales, dropdowns, open-ended items, and conditional follow-ups. Reorder by drag, clone last year's instrument in a click.
Bilingual delivery
English by default with an optional Spanish version. Respondents switch languages mid-survey and the language taken is logged with the response.
Standardized demographics
Region, division, job role, years of service, generation, supervisor status and more — with sub-demographics so every cut of the data lines up year over year.
Results that filter
Section and per-question scores, response distributions, polarization flags, and demographic filters applied across the whole report.
Benchmarking & year over year
Compare against prior survey cycles and an industry benchmark set to see whether culture is actually moving.
Executive closeout report
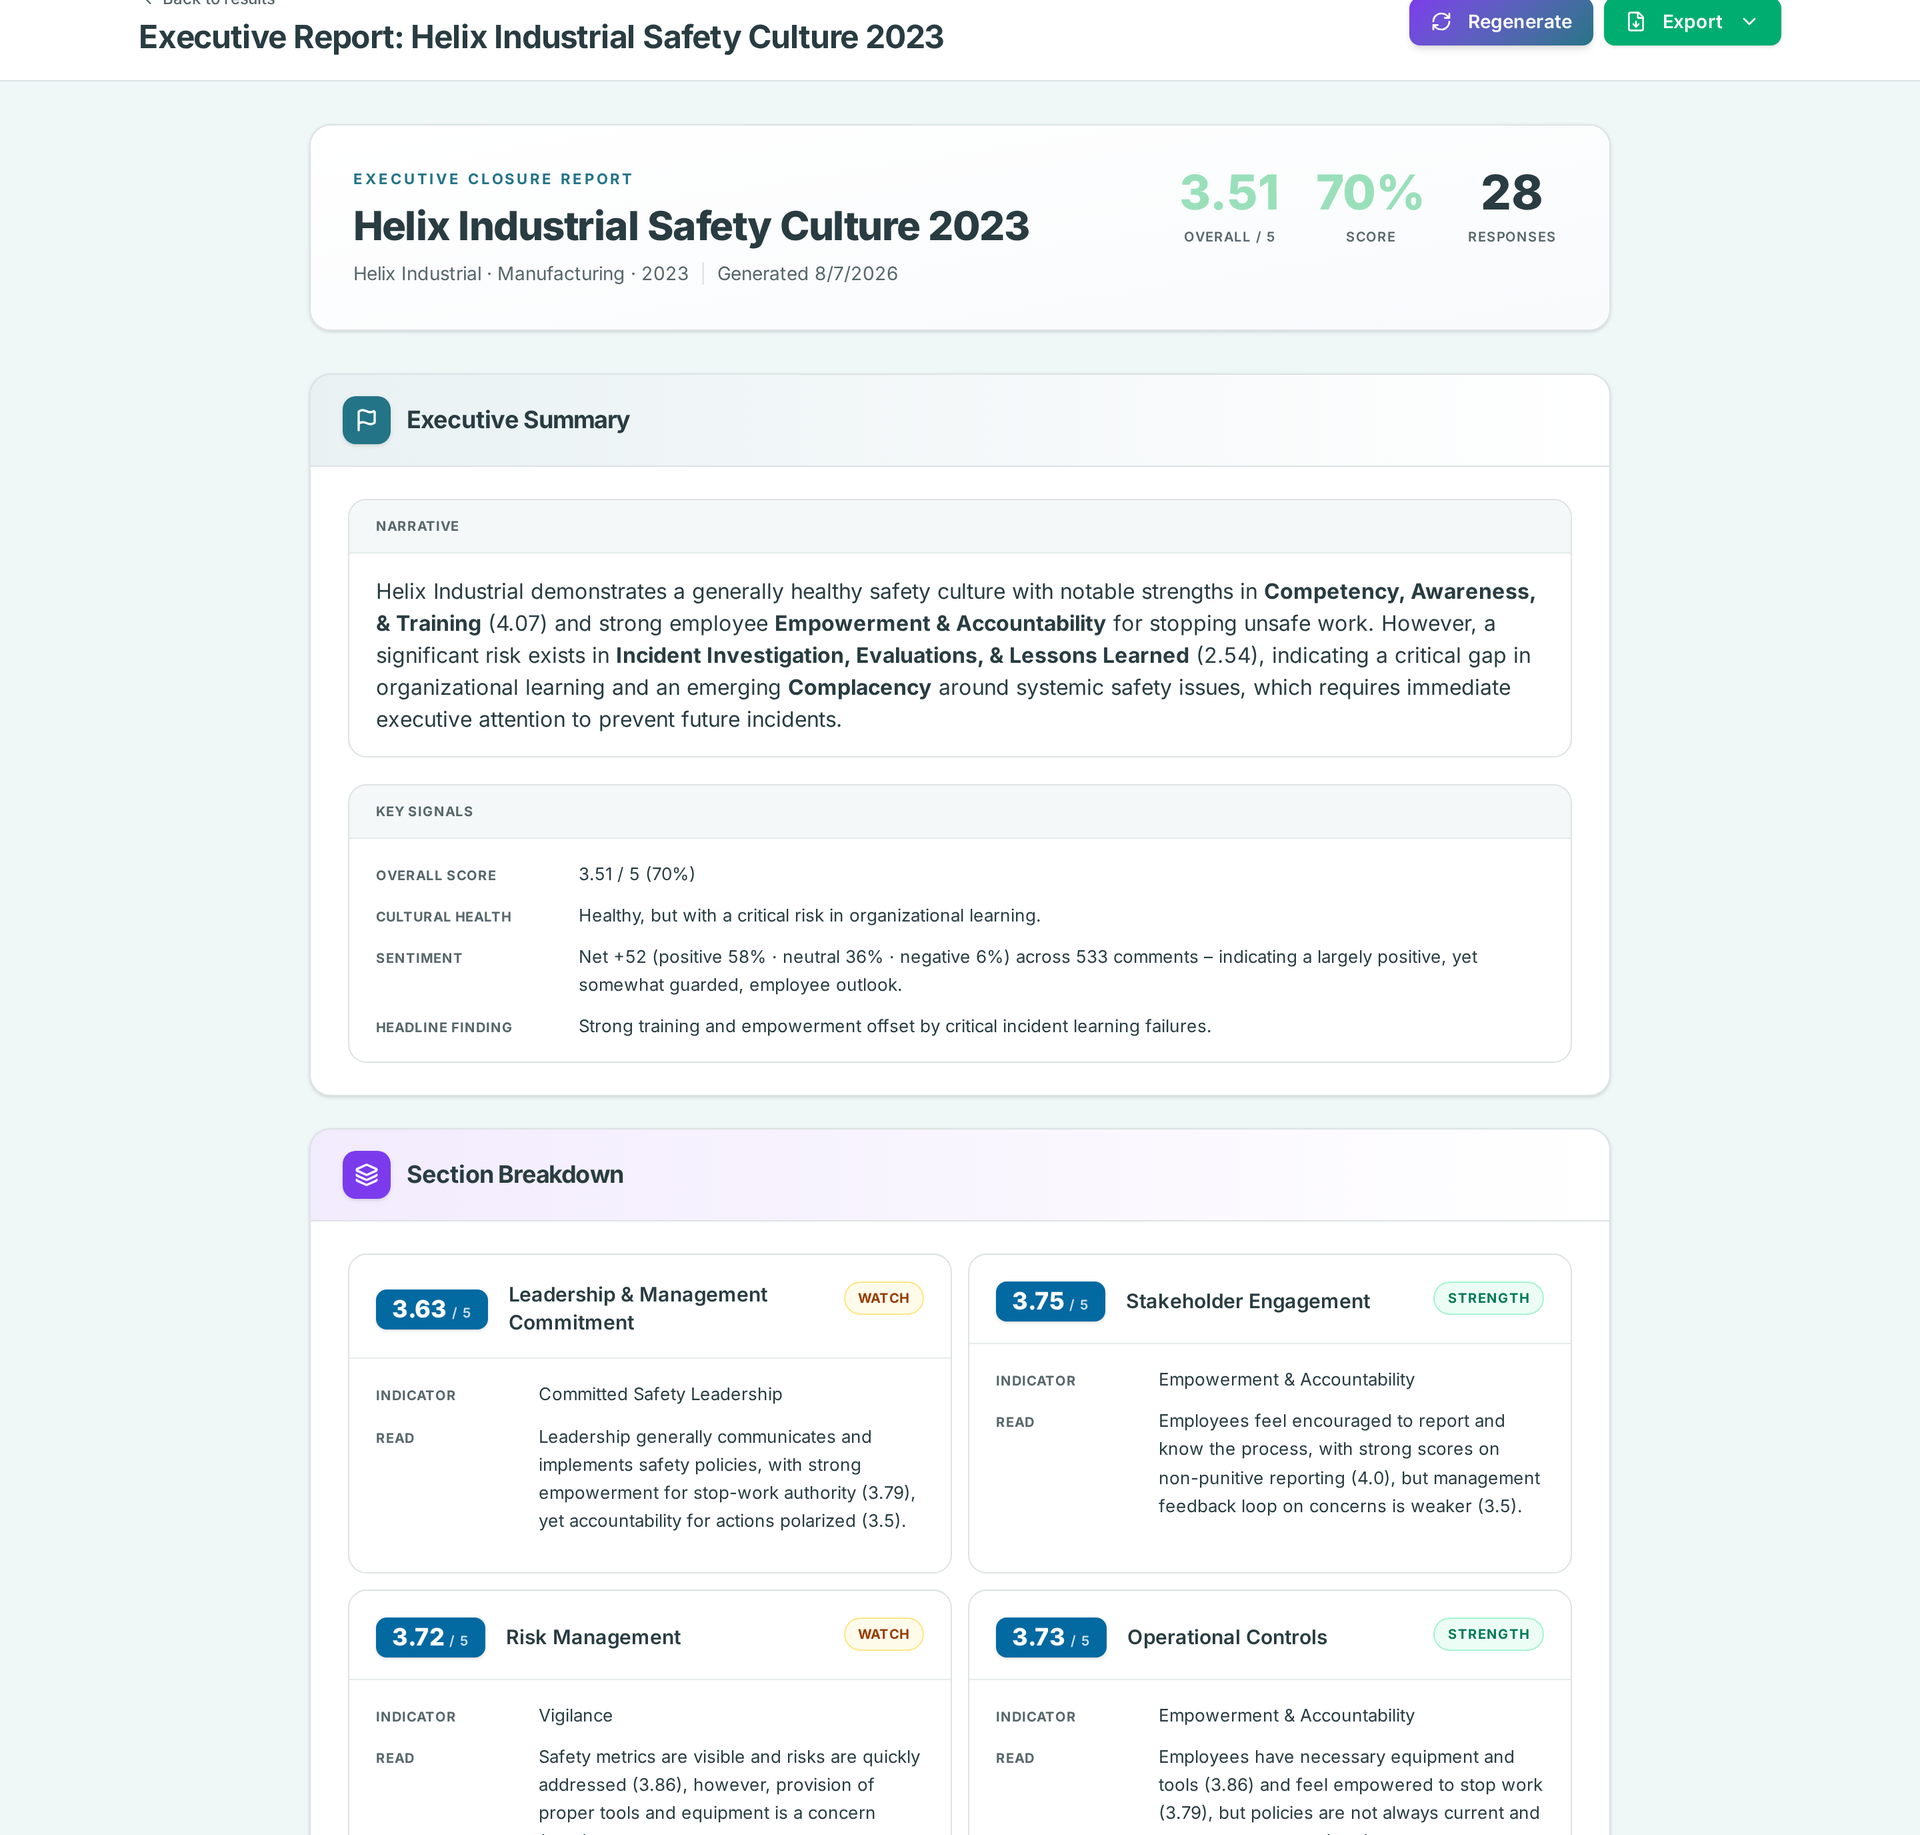
A client-ready narrative: key signals, positive and destructive culture patterns, and a prioritized action plan from quick wins to long term.
Legacy data import
Bring historical results from spreadsheets or a prior survey tool, mapped to companies and years so trend lines start on day one.
Roles and access control
Admin and client roles, per-company client portals, anonymous respondent links, and row-level security on every table.
THE CLOSEOUT
A report your leadership actually reads
When the cycle closes, one client-ready narrative turns the data into decisions, not a raw export nobody opens.
- Key signals and score movements called out in plain language
- Positive and destructive culture patterns, side by side
- A prioritized action plan from quick wins to long term
- High-level sentiment on open-ended comments, kept concise
CONTEXT, NOT JUST SCORES
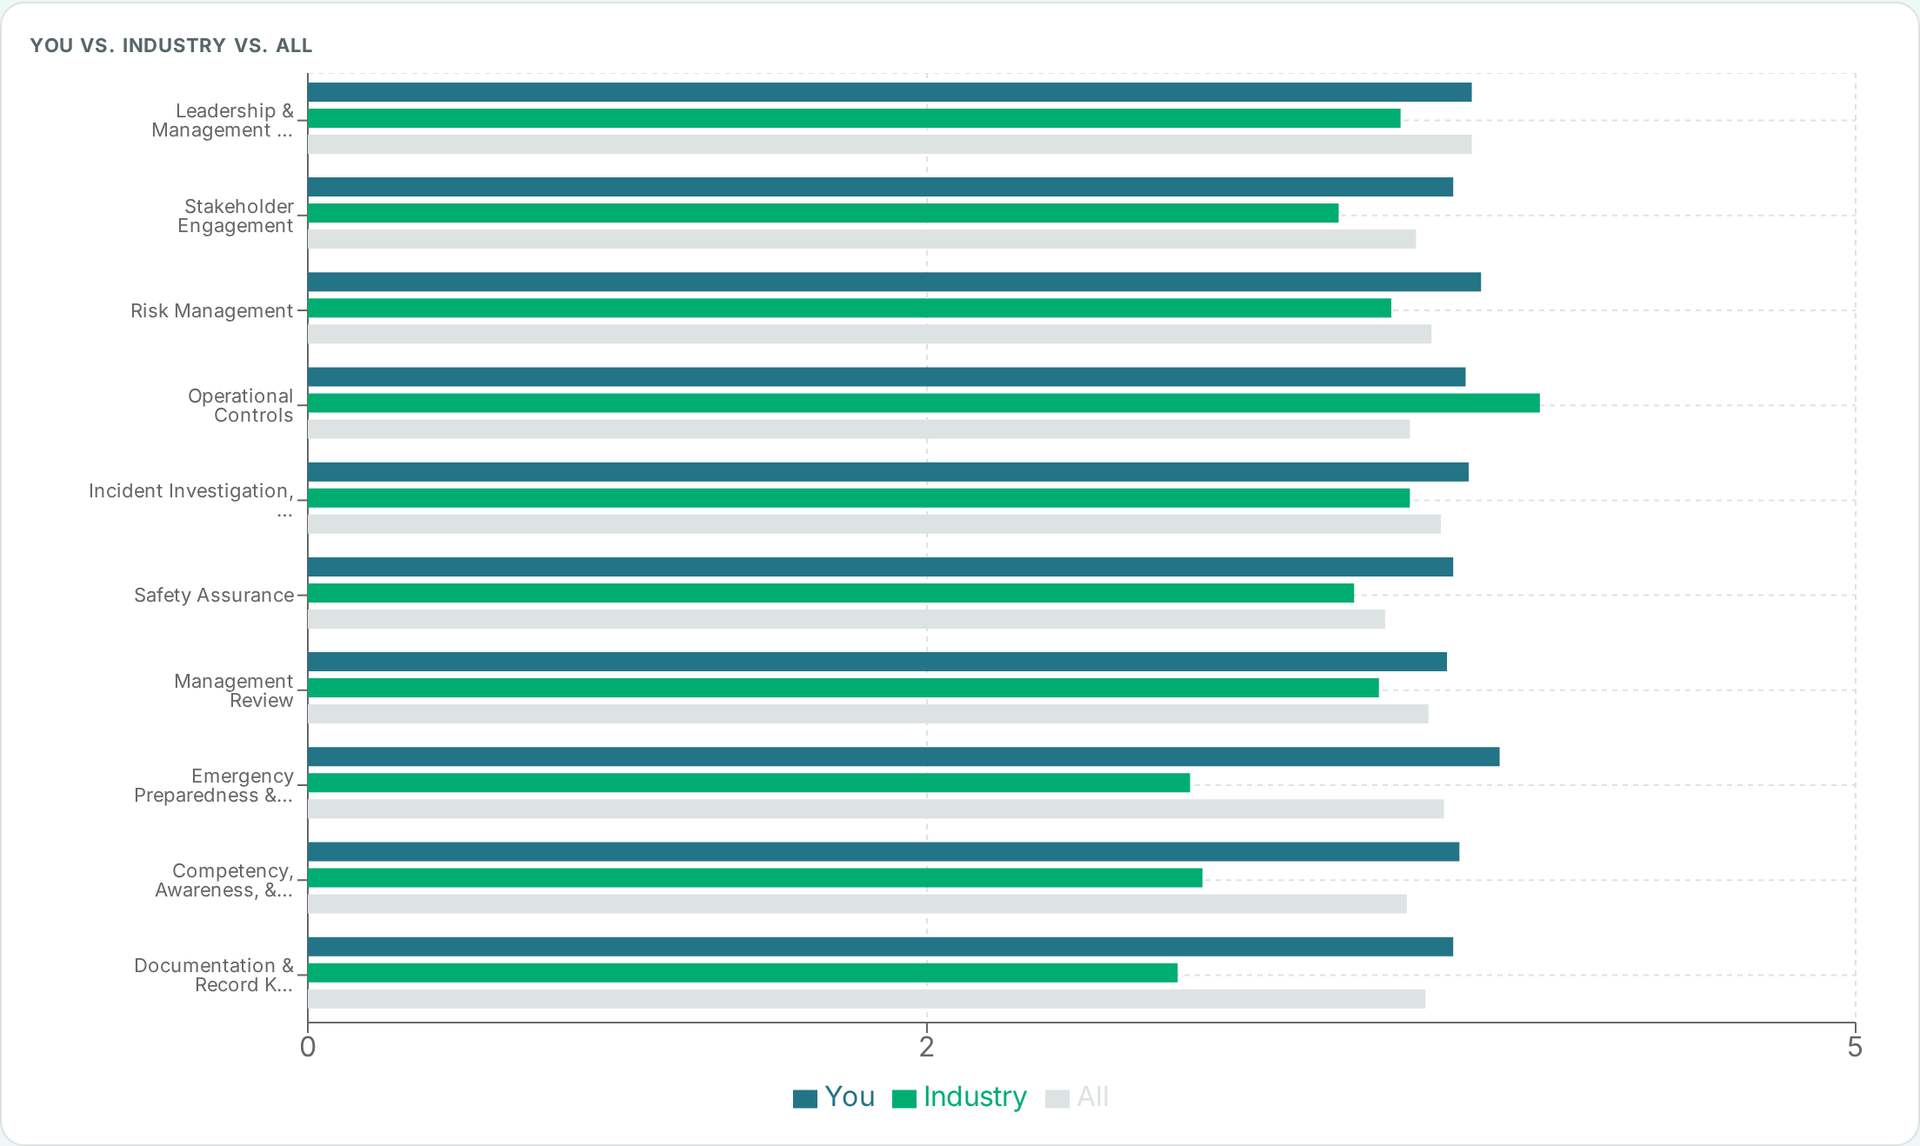
See how you stack up — against your industry and against last year
Every cycle is scored against peer utilities and contractors in the same year, tracked year over year, and mapped element by element.
HOW IT WORKS
From blank slate to boardroom in one cycle
Four steps, one owner, no dead ends.
01
Build or import
Start from the safety culture instrument, adapt it, or import your historical cycles to establish a baseline.
02
Go live and collect
One shareable link per survey. No respondent logins, drafts save automatically, and submissions stream in with timestamps.
03
Benchmark and cut
Section scores, distributions, sentiment on open-ended comments, and demographic cuts — all filterable in one place.
04
Close out and act
Generate the executive closeout report, share the client portal, and track the action plan into the next cycle.
WHO IT'S FOR
Built for organizations with real hazard exposure
If an incident is expensive, culture data is cheap.
Pipeline & utility operators
Meet API RP 1173 expectations with evidence, not paperwork. Culture data tied to a real safety management system.
Safety consultancies
Run branded survey cycles for every client from one admin console, with per-company logos, portals, and reports.
Multi-site contractors
Compare divisions, regions, and crews to find pockets of risk long before they show up in incident numbers.
FAQ
Common questions
Are responses anonymous?
Yes. Respondents open a public link with no login. Demographics are collected as groupings, and reporting is designed around aggregate cuts rather than individuals.
Can we keep using our existing questionnaire?
Yes. Any instrument can be built in the survey builder, and prior years can be imported so your existing questions keep their history.
How do our clients or leaders see results?
Each company gets a client portal showing their surveys, live submission counts, and reports once a cycle is closed out.
What do we get at the end of a cycle?
A cached executive closeout report with key signals, culture patterns, and a prioritized action plan, plus CSV and Power BI exports of the underlying data.
Ready to improve your safety culture?
Send us a prior cycle and we'll load it, benchmark it, and walk you through the closeout report on a 30 minute call.